C
WRITING AND FORMAT OF REPORTS
Introduction
Many agencies recognize two types of report: reports intended for internal use only, and those that will be distributed externally, and entered in databases such as the Transportation Research Information Services (TRIS). In the past, external reports were often high quality publications that included typeset text and professionally drawn graphics. The availability of desktop publishing software has largely blurred the distinction between reports on the basis of production standards. However, internal reports still tend to be less formal, and of a lower standard, than reports prepared for external distribution.
This appendix complements the contents of Chapter Five by providing guidance relating to the writing of reports, particularly those for external publication or distribution. Most of the recommendations for format are taken from instructions prepared by the Transportation Research Board. In situations where the publisher, be it the research agency, a technical society, or a commercial publisher, has specific rules for style and format, these will obviously take precedence. The appendix also describes types of figures used in reports, and gives several examples.
Process of Writing
The process of writing consists of two steps:
1. Have something to say
2. Say it clearly and concisely.
In many ways, reporting the results of research is much easier than creative writing, where the biggest challenge is often to find a suitable topic. By the time a research report is written, the “have something to say” criterion should be easy to satisfy. “Having something to say” does not mean that the entire content of the report is in the author’s head. It means that the author has information to convey, and a reasonably firm idea of the scope of the report.
It is difficult to organize one’s thoughts without first developing an outline. The outline should consist of a series of headings and subheadings. The initial outline can be quite brief, though the larger the report, the more important it is to identify the number, and the subject matter, of the chapters and appendices as early in the writing process as possible. This allows for the correct cross-referencing between chapters as the report is written, because they are easily missed when the report is edited. Many writers find it useful to annotate the outline with hand-written comments identifying sources of information, adding topics, considering which topics could be combined or eliminated, and rearranging the order in which topics are to be presented. When the outline is embellished by so many notes, arrows, deletions and reminders that it becomes confusing, a clean, typed version is produced, and the process begins again. It is important to regard the outline as a “living” document that is subject to continuous improvement as ideas develop and new sources of information emerge.
Writing habits are intensely personal. For many people, a location free from interruption is essential for getting one’s writing done. A suggestion for avoiding “writer’s block” (that frustrating feeling of staring at a blank page, or empty screen, and being unable to find the right words, or any words) is to remember that articles and reports do not have to be written by starting at page one. Begin with the sections that are the easiest, or of the greatest interest. For technical reports, this may involve writing the methodology and results, before writing the discussion and introduction. For articles, one approach is to prepare complete paragraphs of information likely to be included in the finished document. Paragraphs on similar topics can then be collected, and rearrange or eliminated without affecting the contents. This technique is useful for coping with an overwhelming number of facts and ideas, and for organizing the text.
The key is to start writing something as soon as possible. It is much easier to revise a draft, no matter how rough, than to create it. It has been suggested (19) that the first draft be written without regard for grammar and spelling, because stopping to find the correct word or sentence structure interferes with the creative writing process. It is argued that the processes of writing and revision are entirely different, and utilize skills that are mutually exclusive. Revision should follow some time after writing, when the author can be objective, and reflect on the organization and content in a critical manner. In writing the first draft, gaps will inevitably be identified and time will be needed to locate the required information. For example, once a draft of the methodology and results has been prepared, it will be clear whether more photographs must be taken or whether the assistance of others is needed to construct figures or to format tables.
Writers should expect to prepare at least two or three drafts to incorporate changes they feel are necessary, and to reflect the comments of others. This requires that the first draft be written well in advance of the publication deadline. Even where there is no formal requirement for review of draft reports, by supervisors, peers, management or sponsors for example, it is a good idea to ask a colleague to review an early draft. There is no better test of whether the document is understandable, and suitable for the intended audience. Where assistance with editing is available, it is a good idea to give a copy of the document to the editor before completing the final draft, because this can smooth the production process.
In practice, many reports or papers are written just before the deadline - or even a few days later! This is probably because most people do not enjoy writing, and therefore procrastinate. Others find that they write most effectively if they work extended hours in response to an impending deadline. “It focuses the mind” is the usual explanation for such behaviour. One should be guided by one’s work habits, and do whatever works best in the circumstances. However, even a last-minute blitz demands careful planning to ensure that reference articles and illustrations are available. Do not expect that copies of obscure journal articles and needed photographs will appear miraculously at midnight before a 9:00 a.m. deadline!
Writing Style
The purpose of technical writing is to convey information accurately, whereas the main purpose of creative writing is to entertain. As a result, the language of technical writing tends to be utilitarian, and creativity is sacrificed for clarity, precision and organization. This does not mean that spelling, grammar and sentence construction can be compromised; only that there is less use of imagery and figures of speech. There are some technical writers, who can incorporate creative expression in their articles, but such writers are rare, and, in the early stages of one’s career, it is better to concentrate one’s efforts on communicating concisely, clearly and accurately.
Conciseness means expressing an idea or conveying information in the least number of words. Consequently, the words must be chosen carefully, avoiding jargon, circumlocutions and rambling sentences. Comments or ideas should not be introduced as a matter of interest; they must be essential to the content. Concise writing is easier and quicker to read, and more readily understood. Clarity means that the writing is free from ambiguity and that the meaning is the same to all readers. Accuracy means that the writing is free from errors. This is vital in reporting the results of research because readers rely on the information presented to be correct. Errors, whether experimental or the result of poor writing, reflect badly on the author’s reputation.
A fundamental step before beginning any writing is to define the intended audience. In the case of articles in commercial publications, or the journals of technical societies, it is relatively easy to identify the audience because the publisher knows the subscribers and members. In the case of one-of-a-kind documents, such as this manual, the author must define the intended audience. This is important because the educational level of the audience determines the level of writing, in terms of vocabulary and sentence structure. The experience level of the audience determines how much background information must be provided to make the document understandable.
Write in everyday language, but avoid the colloquialisms and poor sentence structure that are common in everyday speech. Remember that speech is transient; the words cannot be inspected for very long. Often, the meaning of speech defies rational analysis because we begin to talk before we know exactly what we are going to say, and often, we do not complete our sentences. On the other hand, writing is a technique for rigorous thinking and a process for organizing our thoughts. Writing freezes our thoughts in a permanent record.
Technical and scientific writing can be made much easier to read and understand through good organization of the report or article. The order in which topics should be presented depends upon the nature of the material. The sequence must be logical and, as a general rule, proceed from the general to the specific. This means that details should not be described before the big picture has been presented. Other sequences that may be applicable are chronological, problem to solution, or laboratory to field. When describing equipment, the sequence may be determined by the juxtaposition of components (e.g. left to right or top to bottom), or by the order of operation. Providing transitions and connecting statements enhance comprehension so that the ideas and information flow smoothly. Difficult concepts should be illustrated by figures or examples. A common mistake is to overestimate the knowledge of the audience. Never be afraid to set the scene, offer alternative explanations for difficult points (e.g. “in other words.....”), and explain the significance of procedures and findings.
Technical writing should not project the author’s personality. It must be objective, and free from personal beliefs and opinions. The word “I” should not be used. It is customary to write in the third person and the passive voice. The purpose of using these techniques is to convey the information with as few distractions to the reader as possible.
Incorrect spelling, punctuation and grammar also detract from the content and readability of a report. The spell check and thesaurus features of word-processing software are helpful, but they demand that the user recognize the correct spelling of a word, and be able to use it in the correct context. Spellcheckers are most useful for finding typographic errors. Grammar checkers are also useful for identifying obvious errors, and lengthy sentences, but they will not turn deficient language into high quality prose. Often, the checker stops on correct phrases, and checking a long document can be tedious. However, a grammar checker can also be very helpful, especially if one is aware of one’s most common writing mistakes, and uses the checker to help find them. An author must be proficient in vocabulary and grammar to write successfully. There are no short cuts.
Readability Indices
Indices have been developed to measure the readability, or ease of comprehension, of a piece of writing. Most are based on taking a sample of text and determining the number of sentences, words and syllables. Some indices such as the Fog Index, developed by Robert Gunning, and Fry’s Readability Graph express the result as the grade level of education needed to understand the text. A simpler method is to count the number of one-syllable words in a 150 sample that is part of a coherent passage. The reading grade level is calculated from:
Reading Grade Level (RGL) = 20 - No. of one syllable words
10
For example, if there are 79 words of one syllable, the RGL is 20 - 7.9, or 12.1.
Some grammar checkers will count syllables, words, sentences, and paragraphs, and calculate averages. This eliminates the tedium of counting, and permits a larger sample of writing to be examined.
Technical writing, by its nature, is more complex than prose, and is usually directed at an educated audience. A reading grade level of 12 is satisfactory for most technical writing, and should not exceed 14.
An alternative approach is to apply the Clear River Test, which states that all the following criteria should be satisfied so as not to impede comprehension:
· 25 words or less per sentence
· 12 words or less per punctuated pause
· 75 words or less per paragraph
· 150 syllables or less per 100 words.
Readability tests are guides, not rules. Nevertheless, it is useful to check one’s writing occasionally to avoid obfuscation.
Format of Reports
The publisher determines the format of a research report or paper. Many agencies have developed a standardized format; technical societies and commercial publishers have developed instructions that must be followed by prospective authors. This is necessary because there are many ways of dealing with units, references, figures and tables. It is not that some ways are right, and others wrong. By adopting a standard format (which often involves arbitrary decisions), a report, and especially a journal which includes work by several authors, is easier to read, and more pleasing and professional in appearance. Most of the suggestions for format contained in this section are taken from the booklet “Information for Authors and Speakers” prepared by the Transportation Research Board.
Headings
Headings should be limited to four levels. Various combinations of indent, boldface, italic and underlining can be used to distinguish between the levels. The format used by TRB, and in this manual, is:
Level One: All capitals, boldface
Level Two: Initial capitals, boldface
Level Three: Italicised, initial capitals
Level Four: Italicised, initial capitals, run into text and followed by a colon.
An alternative approach, made possible by the introduction of printers with scalable fonts, is to use four sizes of boldface type.
Spelling, Grammar and Symbols
Spelling, grammar, and symbols should be in accordance with standard reference texts. TRB uses Webster’s Third International Dictionary and the Chicago Manual of Style as the basic reference documents. Authors should avoid jargon, acronyms, use of personal pronouns, and sexist language in manuscripts. Occasionally it is not possible to avoid abbreviations and acronyms. In such cases the first time the acronym is used in the text, it must be spelled out, followed by abbreviation in parentheses.
The word “percent” should be spelled out in text, though the symbol “%” is permissible in tables. Similarly “number” should be used in text, but “No.” in tables. The symbol “#” should not be used because it has a number of meanings.
Units
Measurements are provided in either SI units only, or in both SI and U.S. customary units. SI units should be in accordance with ‘Standard Practice for Use of the International System of Units (SI)’ published by ASTM as E380-91.
When using both SI and customary units in text, the SI units appear first, followed by the customary units in parentheses. In figures and tables, only SI units should be given, with conversions shown in a footnote. Alternatively, in figures, customary units may be shown on the top and right axes of data plots, in which case a footnote is unnecessary.
Care is needed to ensure that the conversion is dimensionally correct. For example, it must be established whether weight in pounds is actually mass, in which case it is converted to kilograms, or force, in which case it is converted to Newtons. Units that are a function of the conditions of measurement can cause difficulties. For example, there is a peel test for measuring the adhesion between rubber and steel, in which the results are expressed in lb/in. However, the test specimen is 1 in. wide. Converting lb/in to N/mm has no relevance unless it is made clear that the value is based on specimens 25mm wide. There are similar difficulties with dimensionless indices. For example, the fineness modulus of sand is derived from measurements made on a specific series of sieve sizes. If the nearest equivalent metric sieve sizes are used, the index changes. Another common error is in not distinguishing between ambient temperatures and temperature differences. An ambient temperature of 5°C is equivalent to 41°F, but a change in temperature of 5°C is equivalent to a change of 9°F.
References
There are a number of ways of citing references in the text and compiling the list of references. In the natural sciences, it is common to cite references by identifying the name of the senior author and year of publication in parentheses at the appropriate place in the text, e.g. (Smith, 1991). The list of references is sorted first alphabetically and second chronologically. The advantage of this method is that references can easily be added or deleted without having to renumber all the other references. The disadvantage is that it becomes awkward when an author has two publications in the same year, e.g. (Smith, 1991a), (Smith, 1991b) and especially if two different authors by the name of Smith publish articles in the same year. Neither does this system work well if several articles are cited at the same place in the text.
In the applied sciences, it is more common to cite references in the text numbered in the order in which they are first cited, e.g. (2), and ordered numerically in the list of references. If a reference is cited more than once, repeat the number first assigned to the reference. Do not repeat the reference in the list or use ibid., idem., op.cit., or loc.cit. to indicate a repeated reference. Reference should not be made to unpublished material, personal communications, or similar material not available to readers from either a library or the originating agency. Instead, if it is necessary to cite unpublished work, state in the text within parentheses the author’s name along with the term ‘unpublished data’.
The format for references is somewhat arbitrary, especially with respect to punctuation. It is important that references are complete. Include the names of all authors or editors; title of article, chapter, book or report; publisher or issuing agency; location of publisher and year of publication; volume and issue or report number; and page numbers. If the publication has no date, use “undated”. References to manuals, specifications, or standards should quote to the edition being cited. The following are examples of references listed according to the format prescribed by TRB.
Book
Haas, R. and W. R. Hudson, Pavement Management Systems, McGraw-Hill, New York, 1978.
Chapter in a book
Silverstein, L. G., “Safe Handling of Epoxy Resin Systems”, in Epoxy Resin Technology, P. E. Bruins, ed., Interscience Publishers, New York, 1968, pp 123-129.
Periodical
Goodspeed, C. H., S. Vanikar and R. Cook, “High-Performance Concrete Defined for Highway Structures”, Concrete International, American Concrete Institute, Detroit, MI., Vol 18, No 2, 1996, pp 62-67.
Report
Rhodes, J. R., J. A. Stout, R. D. Sieberg and J. S. Schindler, In-Sit Determination of the Chloride Content of Portland Cement Concrete Bridge Decks, Report No. FHA/RD-80/030, Federal Highway Administration, Washington DC, 1980, 58pp.
Conference Proceedings
McCullough, B. F. and S. B. Seeds, “Field Validation of an Overlay Design Procedure to Prevent Reflection Cracking”, Proceedings of the Fifth International Conference on the Structural Design of Asphalt Pavements, University of Michigan, Ann Arbor, MI and Delft University of Technology, Netherlands, Vol 1, 1982, pp780-791.
Newspaper Article
Ringle, K., “DC Stoplights: Halt, Lame and a Pain to Maintain”, The Washington Post, March 27, 1983, pA1.
Retyping references to a specified format can be time-consuming and difficult to do without errors. Where possible, references should be entered in an electronic file, in the prescribed format, at the time the literature search is undertaken. In reports that include a large number of references, it is easy to make a mistake in the numerical order in the text. This can happen by not recognizing a repeated reference, or missing a reference that is included in a figure caption, but not the text for example. In large reports it is advisable to use a numbering system corresponding to the references in the electronic file throughout all the drafts, and not arrange them in numerical order until all other changes have been made in the text of the final draft.
Use of Numbers
The following rules apply:
· Always spell out numbers at the beginning of a sentence.
· Within a sentence, use only Arabic numerals with units of measure (e.g. 5mm). Otherwise spell out numbers less than 10 (e.g. “... five bridges were inspected”) and use Arabic numerals for the number 10 and greater.
· Use Arabic numerals for all decimals (e.g. 5.7). For numbers less than one, use a zero to the left of the decimal point (e.g. 0.06).
Equations
Equations used to present serious difficulties when manuscripts were prepared on a typewriter, but the problems have largely disappeared with the use of word processing software. Equations should be expressed in accordance with mathematical practice. Each equation should be numbered in the sequence it appears, using Arabic numerals in parentheses, placed flush right. When referring to the equation in the text, use the abbreviation “Eq” followed by the number in parentheses, e.g. “Using the relationship given in Eq. (2)...”.
Tables
Tables are very useful for summarizing data or text. They should be used to supplement, not duplicate, the text. Tables should be numbered consecutively in the order first cited in the text, using Arabic numerals. Reference must be made to each table by number at the appropriate place in the text.
Captions are placed at the top of each table. The appearance of tables is much improved by eliminating most of the internal horizontal and vertical lines. Each column requires a heading, with the units of measurement. An example of a table that is effective in summarizing data, and is pleasing in appearance, is shown in Table C-1.
Figures
All non-textual material should be referred to as either a figure or table. Do not use terms such as “exhibit”, “photo”, “plate”, “drawing”, “graph”, or “chart”. Line art must be either drawn professionally or be an original print from a high quality printer. For charts, only the main divisions of the grid lines should be shown.
Most publications require photographs to be black-and-white glossy prints that are sharp with good contrast. Photocopies of photographs cannot be reproduced. Because of the cost and time involved in preparing photographs for printing, they should be selected with care, and used only where a line drawing will not suffice. Where color photographs are an option, they should only be used when black and white photographs do not illustrate a feature sufficiently well.
As with tables, figures should be numbered consecutively and cited in the text. Figure captions are placed below the figure. If a figure contains several parts (a,b,c etc.) each part of the figure should be cited in the text and given a caption. It is customary to produce figures that are reduced photographically to fit the space in the printed copy. Figure C-1 shows how the legibility of the original is affected by reduction for publication. A good rule of thumb is that after reduction, the type should be no smaller than 6 points (1.6mm or 1/16in). Lettering, symbols and line weights should be uniform throughout the figure. Where figures will be reduced, the figure captions should be included as part of the text, not the figure; otherwise the captions will be a different size from the remainder of the text, and probably different for each figure.
Table C-1: Example of an Effective Table
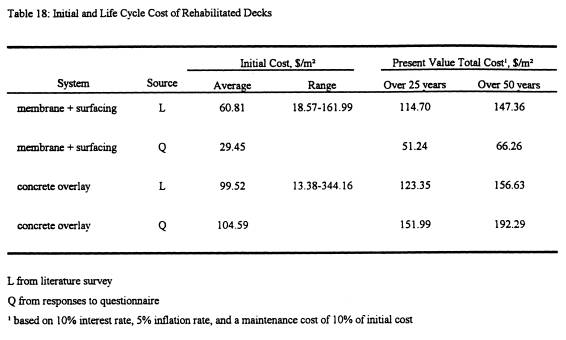
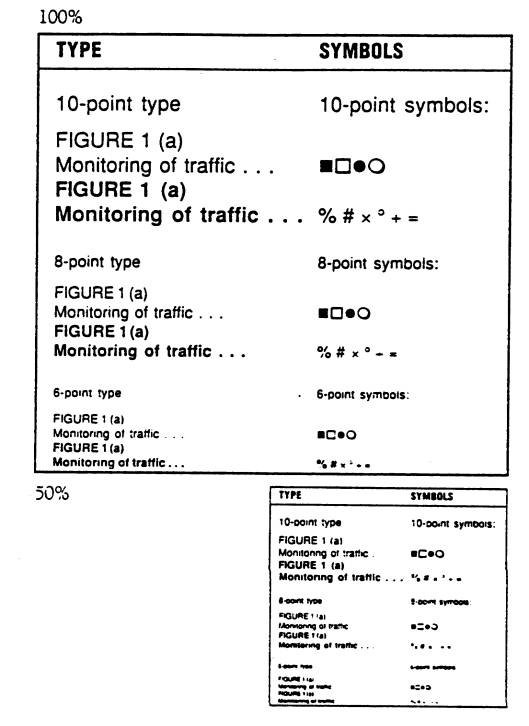
Figure C-1: Effect of 50% Reduction on Type Size and Symbols
Examples of Figures
Figures consist of line drawings, graphs, charts or photographs. Their purpose is to help readers understand the subject matter. They also serve to break up the text, thereby adding interest and eye appeal. Figures should be self-explanatory, and not require detailed explanation in the text. A description, and examples, of several common types of figures, follow. The uses, and some misuses, of graphs are discussed in Chapter Five.
Line Drawings
Diagrams or line drawings can be a very effective way to illustrate a piece of equipment, or explain a procedure or process. Diagrams are not intended to be engineering drawings. The content should be reduced to its simplest form so that the main features, and the relationships between them, are apparent to the reader without a lengthy explanation in the text. Diagrams may be pictorial, which attempt to present the “real” situation, or schematic, which distort the “real” situation for clarity of presentation, or use symbols as, for example, in diagrams of electrical circuits. Examples of a pictorial and schematic diagrams are shown in Figures C-2 and C-3 respectively.
Graphs and Charts
There is no clear distinction between a graph and chart, though a working definition is that a graph consists of data presented in coordinate (Cartesian or polar) form, whereas a chart consists of data presented in any other graphical form (e.g. pie, histograms, or flowcharts).
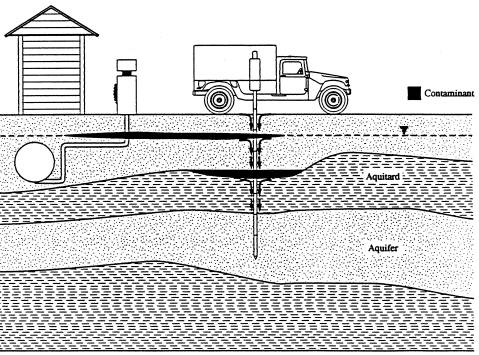
Figure C-2: Example of Pictorial Diagram Showing Potential Contamination Created by Exploratory Holes
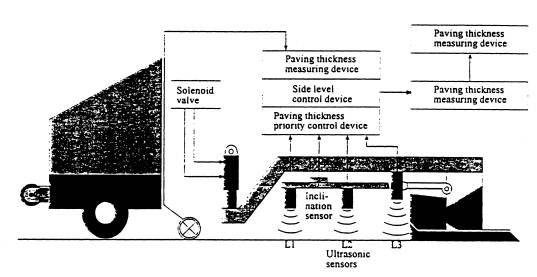
Figure C-3: Example of Schematic Diagram
A run chart is used to record sequential data, such that the vertical axis represents the variable being measured, and the horizontal axis represents time. It is usual to connect the data points by a straight line, because the data points represent discrete samples taken at different times. In other words, the results on a particular day are not affected by the results on any other day, and the objective is to determine trends over time. An example for the average compressive strength of concrete on a job site, using the first 12 data sets from Table C-2, is shown in Figure C-4. By adding control limits to a run chart, a control chart is generated which can be used to control a manufacturing process. The limits must be calculated from the mean and standard deviation. Frequently, two pairs of control limits are used. The first pair represents the warning or inner limits, and is usually set so there is a 2.5 percent probability of a sample mean having a value below the lower limit, and a 2.5 percent probability of its having a value above the upper limit. The action or outer limits are usually set so that there is a 0.1 percent probability of the sample mean falling below the lower outer limit, and 0.1 percent probability of it falling above the upper outer limit. Line graphs are similar to run charts and are usually used to depict trends over time, or the relationship between two variables over a period of time.
Table C-2: Compression Strengths of Concrete Cylinder Sets, Mpa

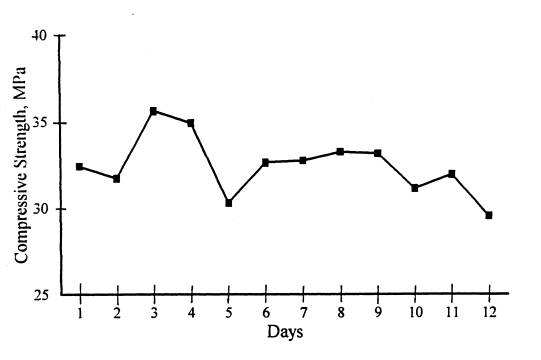
Figure C-4: Example of a Run Chart for the Strength of Concrete Cylinders
Tally Sheets, Bar Graphs and Histograms are used to record the relative frequency of specified events or results. Suppose we have recorded the 75 sets of concrete cylinder strengths shown in Table C-2. We can present the results in a tally sheet by dividing the results into class intervals, usually of equal width, and recording the number of results in each interval as shown in Figure C-5.

Figure C-5: Tally Sheet for Strength of Concrete Cylinders
Every fifth time a record occurs, a slash is used instead of a check mark for ease of counting. The choice of the class intervals is arbitrary. If too many class intervals are used, computation time is increased, and the distribution may appear to be irregular. Similarly, if too few class intervals are used, the character of the distribution may be obscured.
It is preferable to choose class intervals in such a way that no result falls on a class boundary. In the example given, the data are recorded to the nearest 0.1 MPa. A class width of 1 MPa is convenient and class intervals may be chosen as 28.0 to 28.9 MPa, 29.0 to 29.9 MPa etc. For simplicity class intervals of 28 to 29, 29 to 30 are sometimes written down, it being understood those results on the upper boundary are included in the higher class interval.
A simple bar chart can be plotted by taking the data from the tally sheet and plotting the frequency of the results in each class interval as shown in Figure C-6. Bar charts are very effective for illustrating quantitative information, and also provide a convenient way of illustrating comparisons between two or more items.

Figure C-6: Bar Chart for Strength of Concrete Cylinders
A histogram is very similar to a bar chart, but functionally it is similar to a graph because it deals with two continuous variables. In the case of the bar chart, the height of each bar indicates the relative frequency of the events within each class interval. In a histogram, it is the area of each rectangle that represents the frequency in each interval. However, when the widths of class intervals are all the same (which is usually the case) the heights and areas are proportional to one another, and the bar chart and the histogram are the same.
Pie Charts are composed of a circle divided into sectors. The circle represents the total of whole amount, and each sector represents a scaled portion of the total, as shown in Figure C-7. Like bar charts, pie charts may be used to present quantitative information. They are particularly effective for presenting data where relative proportions and general relationships are important. They are less precise than bar charts and other forms of graphs because scales are not easily depicted. It is important to keep the number of sectors to a minimum. In general, the number of sectors should not exceed eight, or the chart becomes difficult to understand. If the raw data suggest that more than eight sectors should be used, some data should be grouped to keep the number to eight or fewer.

Figure C-7: Example of Pie Charts Showing Relative Contributions to Structural Stiffness of Bridges
Flow Charts are a graphic form to show how a series of activities, procedures, or events are related to each other. They indicate the sequence or cycle of events, and how they are connected from beginning to end of a process. Flow charts should be concise and understandable. There is a tendency to make them unnecessarily complicated by displaying every event in the flow chart. This trend may have started with computer programming when it was essential to include all the lines of a program in a flow chart. For most applications, it is preferable to illustrate only the major activities, and their relationships. Figure 3, which illustrates the relationship between the activities in a research program, is an example of a flow chart.