When trying to identify highway safety problems that exist in a jurisdiction, or at a site, it is helpful to study the nature of the crashes in some detail. A detailed understanding of the nature of the crashes being addressed is also useful in making estimates of the effectiveness of various strategies. Fault tree analysis has been used occasionally to help analysts gain a detailed understanding of crashes, and to arrive at quantitative methods for analyzing them. Explanation of the technique can be found in numerous places (e.g., see FHWA, 1981)
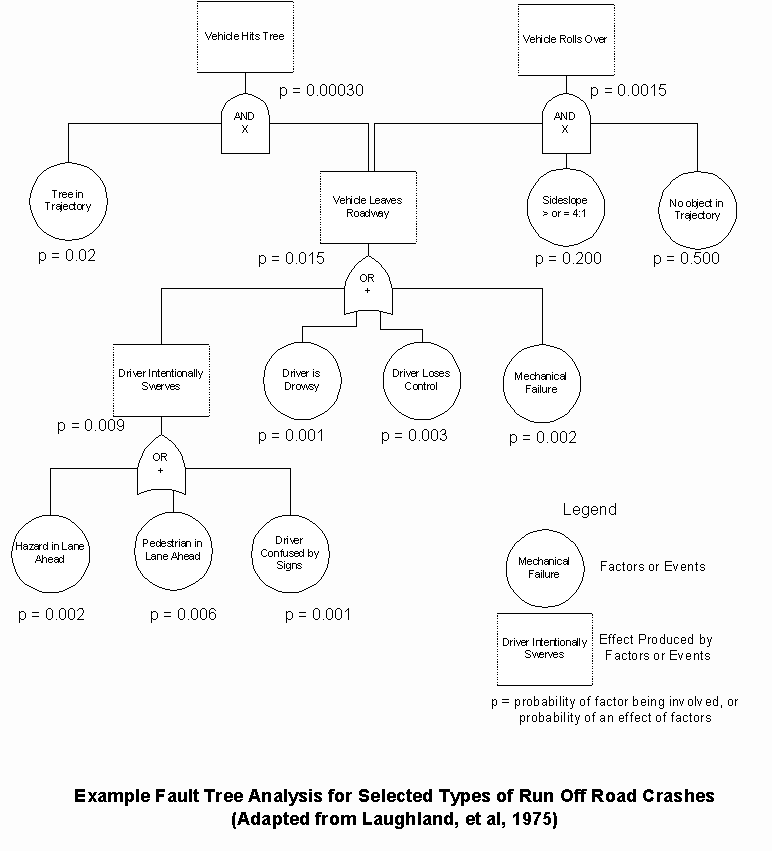
An example of a fault tree is shown in Exhibit 1. In this case, two crash scenarios are shown. One is for a tree crash and the other for a rollover. The diagram focuses upon the immediate pre-crash and crash events related the first or most harmful event. One can also extend this to include crash and post-crash events which allow for analysis of the effect of such things as seat belt use and vehicle design elements.
For Exhibit 1, the analyst has identified what they consider key factors that enter into the sequence of events leading to the crashes. This can be a done, in part, on the basis of crash data summaries, or using sample crash reports. Various factors have been shown, which lead to effects. Some of these effects combine with other factors to produce yet other effects in the sequence, until the crash occurs.
Probabilities are shown for each of the factors, to characterize the likelihood of their presence. In some cases, the probabilities can be derived from data taken from crash summaries. In other cases the data are not available and other bases must be sought for the estimates. The scenarios do not include all factors that could be present. The analyst has chosen the ones that are shown, either because they were the most prevalent, or because they are the ones for which countermeasures may be sought. Probabilities of factors are then combined to determine the probability of an effect, etc., until arriving at a probability of the crash of the selected type occurring (i.e., at the site, or in the population).
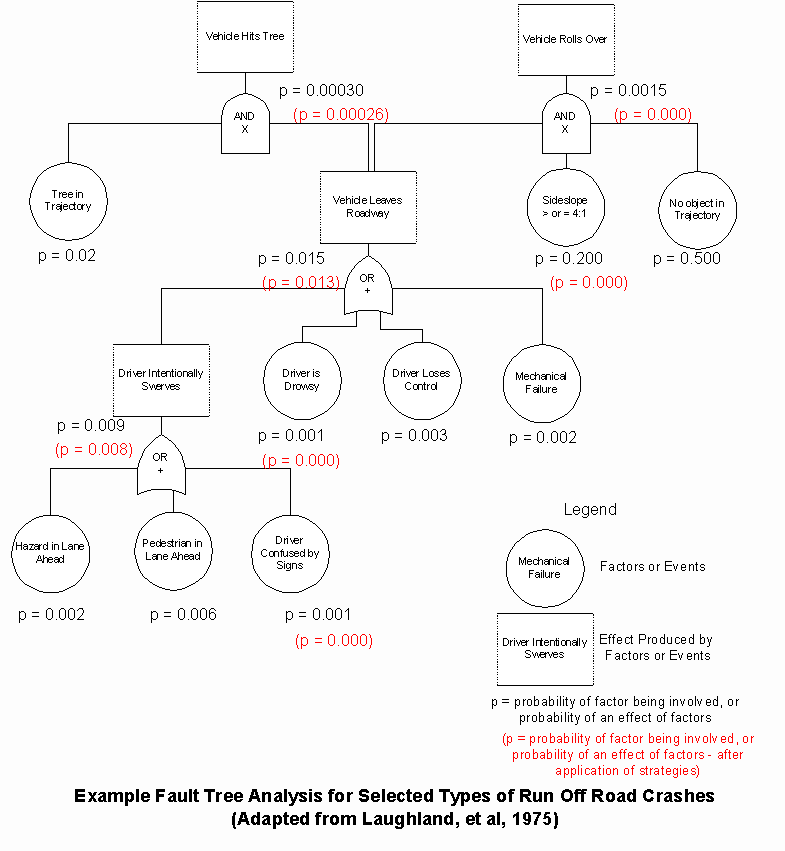
This rather detailed dissection of crash types does require significant resources to produce. However, it can produce useful insights, as well as quantitative information. For example, Exhibit 2 demonstrates its use for estimating the effectiveness of applying various strategies. After studying the fault tree, three different strategies have been selected for trial.
Mid-lane rumble strips: directed primarily at drowsy drivers
Improved pavement markings: to help provide positive guidance to confused drivers
Roadside slope flattening: to bring all slopes to a recoverable condition
The analysts have estimated the individual effectiveness as shown in red on the fault tree. The pavement markings are estimated to eliminate the driver confusion that led to drivers swerving. The rumble strips have been estimated to eliminate drowsy drivers leaving the road. The flattening of side slopes has been estimated to essentially eliminate all rollovers of vehicles that reach the roadside. The fault tree allows the analyst to combine the effects in an overall estimate of the probability of the crash types occurring after application of the strategies. It shows an estimated elimination of rollovers for that vehicle reaching the roadside, and slightly more than a 13 percent reduction in the probability of tree crashes (even without removing any trees). As with any other analysis in which many assumptions are made and uncertainty is present, the assumed values for the probabilities should be varied, to perform a sensitivity analysis. This will allow the stakeholders to see which are the critical assumptions, and to determine if there can be consensus about what to use.
This is just one example of how a detailed study of crashes can help make more informed judgments both about the safety problems that are present and the effectiveness of strategies that are being considered to deal with the problems.
Exhibit 1

Exhibit 2

Highway Safety Improvement Program (HSIP), Federal Highway Administration, Report FHWA TS 81 218, December 1981, 259pp.