Chapter
4
DATA COLLECTION AND MANAGEMENT
This chapter deals with questions that arise in data management, beyond those related to data analysis. These questions arise at several points in the life of the project: before, during and after data collection, after data analysis, and after the study is complete. The general recommendation is that the subsidiary checks and procedures suggested here are necessary supplements to the main analysis; they may be tedious but they enhance the validity of the final product, improve access to it, and consequently, the long-term value realized from the project.
Decisions on Form of the Data Set
If data are assembled into records, and records into files, ordering is necessary so that information can be obtained easily when it is needed. The organization of data and files must mimic the broad form of the experiment. In generic terms an experiment consists always of a set of objects, and on each a number of variables is recorded. Several questions naturally follow:
The Question of Aggregation
The trade off here is between avoiding at one extreme, masking of effects when too much is pooled to make up too few "individuals" and at the other extreme, computational expense when the aggregations are too small and too many. The example of freeway flow analysis might well illustrate this point. Suppose "efficiency" of the freeway is to be measured by delays incurred over sections of it. If an entire urban bypass is to be taken as one section, we might get some idea of system congestion, but none about particular bottleneck sections, which might be improved by spot treatments such as restriping a merge-diverge area. On the other hand, if we took every 100 m as individual sections of interest, we could be lost in the complexity of micro-movements and computations.
Grouping of Individuals
Let us continue with the freeway example. There is reason to group different sections of freeway together to see if there is a common pattern. If there are several long upgrades, and a significant truck percentage in the traffic mix, then it might be useful to consider them together to see if they make up a clearly identifiable kind of problem, different from other kinds of problems on flatter sections of highway. Similarly, if for some reason sections of the freeway enjoy better response times from emergency vehicles when there is an accident, then these sections should be grouped together if accident-related delays are of interest.
Arbitrary versus Natural Hierarchies
Questions posed by researchers lead naturally to hierarchies. The proper identification of these hierarchies and corresponding arrangement of data records and files will help initial visual inspection as well as analysis.
Example:
Suppose a researcher is interested in safety and traffic flow data for 10 km sections of two-lane rural highway. Suppose the following information has been collected in the years shown:
(1994) Number of passing zones (1995) Number of avalanche occurrences
(1994) Shoulder width (1995) Number of head-on collisions
(1995) Delays
The researcher may have information sorted somewhat arbitrarily by year, or it could be sorted more naturally to show the connections, e.g.
Avalanches - Shoulder width - Delays
Passing zones - Head-on collisions
Abstraction to Variables
To continue with the freeway case, we can estimate average delay by timing a large number of vehicles over stretches of highway during free-flow conditions, and then again during peak periods. The logistics of such an exercise - how many people, where do we put them - are considerable. On the other hand, very good exploratory data at least might be obtained by the floating car technique, and some simple index of delay such as time spent traveling at less than 30 km per hour.
Split Samples
The higher the value of the coefficient of determination, R-sq; the more likely it is that the equation will be viewed favorably. However, there is always the possibility of the criticism that R-sq is a criterion based on the ability to explain the chance peculiarities of a particular sample. It is advisable, if there are enough data to split the sample, to develop relationships using one portion, and then to use the other portion to test the predictions of the relationships. Reasonable predictions for different data will go a long way to develop credibility of the analysis.
Mechanics - Notebooks and Records
Field and laboratory notebooks should be permanently and strongly bound and of sufficient size, roughly 200 mm by 250 mm, with numbered pages. Loose-leaf pages are too easily lost. An exception might be the case of routine, repeated measurements, for which printed or photocopied blanks are useful, provided a good system is established for collecting and binding the separate sheets.
Data should be entered directly into the notebook at the time of observation. It is unacceptable to use memory, or scraps of paper, for primary recording, because error or loss would seem inevitable. Data should always be entered in their most primary form, not after recalculation or transformation. For example, if it is the ratio of two observations that is of interest, but it is the two numbers that are actually observed, then the two numbers should be recorded.
Notebooks should carry the name of the user and dates covered. The first eight or ten pages should be reserved for a table of contents. Every entry should be dated, and if several individuals use one book (not generally recommended), initialed.
Data should be recorded in ink. Whenever feasible, rough graphs should be drawn while the experiment is in progress. If the quantity of data is very large, then graphs can be drawn for a randomly picked fraction. This early rough work gives a timely reading on whether the general relationships anticipated are in evidence. If they are not, the opportunity will be there to find out whether some operator error is present.
Bad or unpromising experiments should be fully recorded. Often, much later, something salvageable might be found. At the very least, there will be a permanent reminder of what went wrong!
There are several reasons why good scientific records will help in research. First, good records will help in the recognition of patterns. Patterns emerge as a common feature of two sets of observations separated in time. Second, they are an essential supplement to human memory in keeping an explicit picture of any investigation. Without records, an individual or an agency is condemned to repeating investigations that were completed in the past. It is sometimes necessary to replicate an original experiment, e.g. to see if results are repeatable, but unconscious and inadvertent replication is not desirable. Third, the researcher may wish to build on past work. Studying the records of past work will facilitate systematic extensions of the state of knowledge.
Guidelines on Data Collection from Road-Level Instrumentation
In the last decade, road level sensor installations have evolved considerably beyond the simple traffic monitoring devices like road hoses and even permanent counting stations. With the proliferation of the weigh-in-motion installations that became the centerpiece of the SHRP Long Term Pavement Performance research program, as well as sensors that collect information for "road weather information systems", many issues have arisen concerning the quality of data obtainable from these systems. In particular, questions concerning accuracy and reliability of equipment have become quite contentious. This short section confines itself to some generic considerations related to reliability.
Data collection systems that process and transmit road level data to office computers are complex simply because there is a chain of processing stages and the diagnostics currently supplied by vendors fall short of uniquely attributing apparent data errors to any particular processing stage. It is useful to think of three sources of error, mechanical or electronic malfunction, systematic data error, and random data error.
Malfunction is usually hardware related and may arise from a number of causes ranging from rodents in the roadside cabinets to lightning strikes. Physical investigation of hardware components is the only recourse. A malfunction can also arise from changes in the physical condition of the road such as pavement cracking, for which the only solution may be the next overlay.
Systematic error is that component of total error that is due to a shift or drift of some parameter from its optimal setting. Re-calibration is the only remedy here.
Random error arises as a result of non-constant responses of the physical roadway components to the stimulus being measured. It varies in both size and sign. An example is the different "spring settings" that may arise in a truck's suspension because of road roughness on the approach to a weigh-in-motion scale, causing variation in the dynamic loads recorded. In this case the same stretch of road can cause both underestimates and overestimates. Plausible sources might be explored one at a time, and some attempt made to squeeze down the net random error, but it will never be eliminated completely.
Identifying and Filling Gaps in the Data
If only a few data points are missing in a random pattern, the result of the analysis might still not be seriously flawed. If the missing data are not randomly distributed, our ability to generalize the final results will be lowered. A number of strategies exist for addressing the missing data problem.
Dropping
One might examine pair-wise correlations between the dependent variable and all the independent variables, the so-called correlation matrix, for two possible diagnostic leads. If some independent variable with missing data has a very low correlation with the dependent variable, then it can add little to explaining the variability in the dependent variable and may be dropped safely. If the variable with missing data is highly correlated with other independent variables that do not have missing data, then these other independent variables might be used as a surrogate for the former, and it can be dropped. If the dependent variable has gaps in some particular range then the analysis might still be pursued with the knowledge that the result cannot be generalized to the region with data gaps.
Inserting Values Predicted by Regression
In this approach, in a supplementary analysis, one takes the variable with missing observations and makes it the dependent variable in a regression against the other variables—referred to as imputation. The missing values can then be supplied by evaluating the regression equation at the gaps. Again the "with and without" comparison should be carried out to determine the impact of imputing the missing data.
If analysis with and without the above procedures gives similar results then there is reason for confidence in the analysis. If the results are not similar, then the insertions have somehow distorted the basic meaning of the data, and a closer review is warranted.
A Note on Outliers
Outliers can arise when the combination of corresponding values of two variables does not make sense. For example the value "AADT = 3000" may not be an outlier in the univariate sense, and neither might the value "4 head-on collisions per 50 km stretch". But it would seem unlikely that the two values would be associated on the same road.
Evaluating Data Quality
Consistency: Out of Line Indicators
Quick visual inspection may reveal values that are "out of line". A slightly more structured procedure might follow. Are means, ranges, and standard deviations plausible, based on experience, i.e. are the data too tightly clustered or, alternatively, too widely dispersed? If the answer to either of these questions is yes, then a review of individual observations might be in order.
Several concepts express aspects of how good an observation is: accuracy, precision, validity and repeatability.
Accuracy
The accuracy of a measurement refers to the freedom from error. The term "error" occurs in two usages. First, there is an unrestricted usage, which includes systematic instrument error, e.g. a zero shift, or human error, i.e. a mistake. The second usage of the word "error" refers to random error that occurs with (usually) normal variation. If repeated measurements are made of some quantity of interest, the measurements will cluster around their own mean value. If there is a single true value, then the difference between this value and the mean of the sample of measurements is the error. In a set of accurate measurements, the mean value of the distribution of the measurements is close to the true value.
Precision
Precision refers to the exactness of some set of measurements of the quantity of interest. A precise set of measurements has a small standard deviation. Figure 19 illustrates the distinction between accuracy and precision by showing schematically what the normal distribution of observations would look like for high and low accuracy together with high and low precision. Figure 20 is another schematic representation of these ideas.
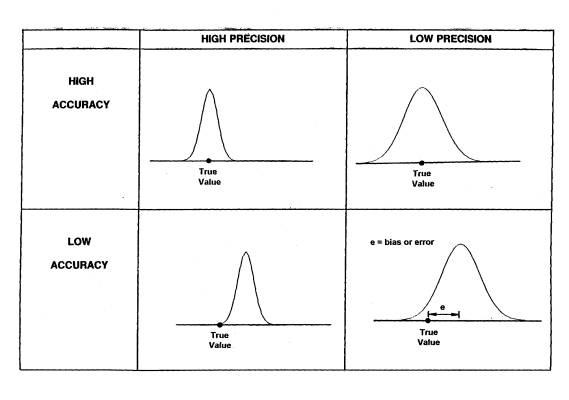
Figure 19: Combinations of Different Levels of Accuracy and Precision
Validity
The validity of a set of measurements is related to researcher expectations, i.e. how well the measurements capture what the researcher intends to capture. An ice detector in the pavement surface may, at a primary level, be measuring the electrochemical properties of the solution on the surface of the pavement, but its validity in a maintenance management system relates to how well it can capture the differences pertinent to the clearing of ice and snow.
Repeatability
Repeatability refers to the likelihood of getting similar results from repeated runs of the same experiment. In practice, the actual values will not be repeated exactly, but the mean and standard deviation of successive samples of the same measurements should be close.
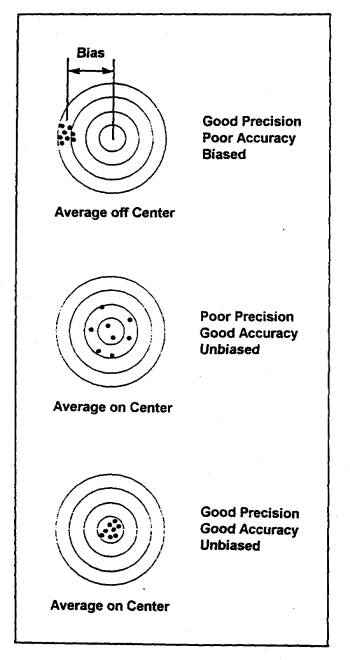
Figure 20: Conceptual Representation of Accuracy, Precision, and Bias
Internal and External Validity
Internal validity refers to the integrity of the experimental procedure and analysis. For example, in experiments in which the ANOVA procedure is to be employed, random assignment of subjects, once selected out of some overall population, is fundamental to the integrity or internal validity of the experiment. External validity refers to the representativeness of the sample; studies of non-random samples from the population under study may lack external validity. Sometimes the procedures to ensure the internal validity of an experiment are collectively called “validation”. Getting the correspondence with the real world is correspondingly called “verification”.
The Case of Deflated Correlation
This can happen if 1) the range of values for one variable is restricted or 2) if an intervening variable mediates between two variables. The following examples might illustrate these cases.
Example 1:
If a safety researcher is interested in the relationship between AADT and accidents on rural highways and picks a remote region where all AADT's are less than 3000, then if there is a good correlation, he is likely to underestimate it with such a restricted range on one variable.
Example 2:
If a materials engineer is interested in developing from a sample of old reinforced concrete bridge decks, a relationship between thickness of asphalt and chloride content, then picking only those bridges in the population which have a waterproofing membrane will likely push down his estimate. The waterproofing membrane intervenes, literally and statistically.
The Case of Inflated Correlation
If composite variables are to be used and two or more composite variables have the same raw data, correlation can be inflated. An example in traffic flow analysis would be the development of correlation between platooning measures, e.g. lengths of platoons and percent of headways less than two seconds. These two variables are composites of the same basic idea, and the correlation obtained is likely to be too high.
Modifying the Research Plan
Review of the results of the analysis can indicate the need for greater or lesser modification of the research plan. The following two sections outline the warrants for both kinds of action.
Complete Overhaul
Every experiment is based on some preliminary assumptions about the world. The very selection of variables presumes that they will give some meaningful explanation, and that the analysis will give some quantitative confirmation of the intuitive beliefs we have about the world. If correlations are low, or the ANOVA procedure fails to turn up any significance between the treatments as we have identified them, then we might have misconstrued the basic physical relationships, we might have abstracted "variables" from the welter of information inappropriately. Since the experimental plan represents the best understanding of the physical nature of our subject that we might have had at the time, some review of existing theory is in order.