Chapter
5
REPORTS AND PRESENTATIONS
A final report, which documents the methodology and findings of the research, is an essential requirement of the every research project. The researcher has an obligation to report failures, as well as successes, so that others can benefit from the experiences. Other researchers may be able to modify the procedures used in an unsuccessful study to produce a positive outcome. But this can only be done if the unsuccessful study is documented properly.
One can also argue that research reports are more likely to be written, and to a higher standard, in agencies which have a strong research function. While this is largely a management and organizational issue, it is a fact that when staff performs research studies that also have line responsibilities, there are pressures to use the results and little incentive to document the findings. Conversely, when research is conducted in accordance with a plan, by staff that recognizes the importance of reports, especially if they can call on the assistance of an editor and report production staff, there is a much greater probability that a high quality report will materialize.
Writing a report is hard work, which may be why some reports are never completed! There is no single way to write a report with respect to organization, content or format. However, there are a number of guidelines, which make the task easier, and improve the quality of the final product.
The other form of publication of interest to the transportation community is the scientific paper. A paper is often written after a final report because, as discussed in Chapter One, publication, especially in a peer-reviewed journal, increases the awareness of the study, and contributes to the professional reputation of the authors. A paper is not a substitute for a final report because limitations on the length of papers usually mean that data, explanations and mathematical derivations must be condensed.
This chapter provides an overview of the content and issues involved in preparing reports, scientific papers, and oral presentations. Background information, format requirements, and examples, are provided in Appendix C.
The amount of subject matter to be included in a typical research report requires that it be organized into chapters. Within each chapter, topics are arranged under headings and subheading so that the presentation follows a logical sequence, related material appears together, and the report is easy to read. Figure 6-1 gives a typical organization for the report of any study that involves the collection and analysis of data. The data do not have to result from an experiment. The outline is equally applicable to data resulting from field investigations, surveys, and questionnaires.
It is much more difficult to provide guidance on the organization of reports of studies which do not involve original data such as state-of-the-art reports, review papers, or case studies. In these situations the chapters or main headings are determined by dividing the subject matter into its major topics, with further subdivision as required. This subdivision is helpful to the writer in ensuring a logical sequence and organization, and to the reader, who can understand the plan and know where to find specific pieces of information. In many cases, the best approach is to model the report on a successful report on a related topic from the same publisher.
The content of each of the major sections listed in Figure 21 is described in the following sections.
Preliminaries
The title should be chosen with great care because it not only provides the first basis on which the prospective reader can decide whether the report is likely to be of interest, but electronic searches of the literature search for key words in the title. It is important to include words in the title under which the paper should appear in a subject index. For this reason, acronyms should not be used in titles. Some publishers discourage beginning the title with “A” or “The”. It is also important that the title be concise and informative. It should not claim too much; neither should it claim too little. Given these competing requirements, several titles should be considered, before choosing the one which best fits the criteria just described. One method, which sometimes works, is to write down the key words, and then link them to form a coherent title.
A preface is an introductory statement, and may not be required. A preface is used to place the work in a broader context. For example it may explain the origins of the study, and the agencies involved. If the report is one of a series of reports, or part of a much larger study, the preface is the appropriate place to provide the details, and discuss the wider goals of the program. Whereas a preface is written by the author, a foreword is written by someone other than the author, often an eminent colleague. A foreword is more common in a book than a report, and may run from two to four pages. The content may range from a review of the work to a testimonial for the author.
An abstract is essential, and vitally important, because abstracts are often entered in databases and searched for key words. They may also be translated into other languages. The abstract should allow the reader to make an informed decision whether to read the report, which often involves resources in securing a copy. The abstract should be self-contained, describe the scope of the study and also the most significant findings. It should not contain abbreviations, equations, or make reference to other documents. There are many inadequate abstracts in the literature. A common failing is to summarize the introduction to the report, while not providing any results. When written well, the abstract is easy to read, but every word has significance.
As noted in Chapter One, an ‘Acknowledgments’ section is included to give credit to those individuals or organizations assisting in the study. In the case of organizations, the assistance may be in the form of sponsorship, donation of materials, or access to private facilities. Individuals might include colleagues who have contributed ideas, or support staff who exceeded their normal duties. While it is magnanimous to recognize assistance from all sources, major contributions should not be trivialized by listing minor involvement. Credits should not be given without first receiving permission.
Preliminaries
Title Page
Preface, Abstracts and Acknowledgments
Table of Contents
List of tables
List of figures
Chapter One: Introduction
Background
Statement of hypotheses
Chapter Two: Literature Review
Review of previous research
Summary of state-of-the-art
Chapter Three: Methodology
Experimental design
Equipment
Procedures
Chapter Four: Findings
Summary of data
Method of analysis
Presentation of results
Chapter Five: Discussion
Validity of hypotheses
Factors affecting the results
Implications
Chapter Six: Conclusions
Conclusions from the study
Suggestions for further work
Chapter Seven: Implementation
References
Appendices
I Glossary and Notation
II Experimental Data
III Derivation of mathematical relationships or details of analytical techniques
Figure 21 Typical Organization of a Report of Research Involving Experimental Work
Preparing the table of contents and the lists of tables and figures is a mechanical process, best done when the contents of the report have been finalized. This is especially true when the table of contents includes page numbers. The table of contents is usually limited to the chapter titles and the first level of headings. Although the process is mechanical, it is surprising how many reports omit some headings, or the headings or captions are not the same as those used in the body of the report.
Introduction
An introduction “sets the scene”. In reports, where space is less of a consideration than in technical papers, the introduction can be quite lengthy and describe the background to the study in some detail. It is useful to explain the reasons for the study, and assist the reader in gaining an appreciation of the problem under investigation. This is followed by a statement of the specific objectives or hypotheses of the study. Where necessary, the final section of the introduction is frequently the best place to define terms used in the report, if a glossary is not provided. It is especially important to provide a definition of terms if there are terms that might be ambiguous, or if some terms are used in the report in specific context.
Literature Review
The chapter reviewing the literature is intended to provide the reader with an understanding of previous work on topics related to the current investigations, and a summary of the current state-of-the-art. Writing this chapter requires, at the very least, an outline and the identification of the most important references. Information on conducting literature searches, and identifying and obtaining reference material is described in Appendix A.
The starting point for writing the chapter is to read what appears to be the most relevant reference first. A worthwhile exercise is to prepare a summary (in note form) of the scope and findings of each report or paper. The summary should then be indexed to record the major topics covered. After reviewing several references, it should be possible to identify the topics to be covered in the chapter, and to make a first attempt at placing them in a logical sequence. The next step is to refine the outline by noting which references provide the most pertinent information on each topic. This will involve scanning one’s notes and probably re-reading some material. This, in turn, will likely result in additional ideas as to how the information might be presented. Ideally, the outline should identify the order of the topics, the most important references, and the order in which the references will be presented on each topic. However, the process is iterative, and reorganization frequently continues throughout the writing of the chapter.
A good literature review comprises a flowing, easy-to-understand narrative, written in the author’s own style. Each topic should be discussed in turn and, while it is often appropriate to discuss the literature on each topic in chronological order, this should not be done slavishly. The topics are then combined in a chapter that should be well organized, and gives the reader a brief, yet reasonably complete picture of the status of the research in the subject area reviewed.
It is not sufficient to simply report the findings of each author. The findings must be placed in context, and connected so that the state of knowledge on each topic emerges. In doing the review, the writer should have gained insights in the subject area that are not apparent to a person not undertaking a thorough review. These insights should be shared with the reader. They can be presented at the conclusion of each topic, or collected to form a summary at the conclusion of the chapter. The process of combining and interpreting the literature is much more difficult than simply reviewing what has been done because it requires a thorough understanding of the significance of each research study reported. However, a well-organized review of the literature, with insightful interpretation, is not only of great benefit to the reader, but is invaluable to the writer in developing an understanding of the area of study.
Fundamental rule is that the original document must always be obtained, reviewed, and reported. Never rely on the review by someone else and report it as your own. If it is not possible to obtain the source document, then quote the article you read, not the original source. For example, state “Smith, as reported by Brown (1), found that...” and reference the publication of Brown, not Smith.
Writing a literature review is not easy, and usually requires practice and several drafts. The ingredients of success are good organization of the topics, a thorough understanding of the material, and a fluid writing style. There are also a number of pitfalls to be avoided:
· Do not make an article-by-article presentation and string them together in an attempt to provide continuity. This form of presentation is tiresome to read, and does not provide an understanding of the subject.
· Do not treat all articles equally. Recognize those that are important and give them prominence. If other studies confirm the most important studies, it is sufficient to say so without providing a summary of the supporting articles.
· Vary the way in which the topics are presented. Organize the information by topic, not by the articles on which the review is based, and let the writing flow naturally.
· Do not make excessive use of quotations or slightly modified text from articles. Insomuch that each quotation comes from a different context, and has a different style, it invariably results in a review that is disjointed and difficult to read.
· Remain objective and do not attack the credibility or work of other researchers. If an error is discovered, it is more courteous, and in the long term more productive, to correspond privately with the individual concerned.
Methodology
The chapter on methodology comprises three sections:
· experimental design,
· equipment,
· procedures.
In describing the experimental design, it is important to explain not only what was done, but also why it was done. This description is needed by the reader to determine the degree to which the research sample is representative of the population, and is comparable to other samples to which the research results may be applicable. The specific details will vary with the nature of the study. For example, if the study is a laboratory investigation of the causes of scaling on concrete pavements, it is important to establish that at least one of the concrete mixes is proportioned and contains ingredients representative of the concrete that has scaled in the field. If the study is a field investigation of cracking in concrete pavements, the method of selecting the sample should be described in detail. If random sampling was employed, the procedure for selecting sections of pavement should be presented. If a system of matching was used, the matching criteria, why these criteria were selected, the number of cases lost because of inability to obtain satisfactory matching, and the possible effect of the loss should be discussed in detail. In matching studies, some evidence of the comparability of the matched groups, i.e. an indication of the success of the matching, should also be given. If stratified sampling was used, the criteria for identifying cases at each of the strata or levels should be described, together with the method for selecting the cases from those available in each level.
The section on the experimental design should also identify the type of experimental design that has been used, and how the design has been employed in the study. There should be sufficient detail presented that another researcher can assess the validity of the experiment.
If the equipment used in the study was commercial equipment, it is sufficient to identify the equipment. If the equipment or apparatus that was used has been adequately described previously in accessible reports or papers, references to these publications should be given. It is then only necessary to provide enough detail that the reader understands the principle of the equipment used, and can obtain more complete information if desired. However, if custom apparatus or equipment was used in the study, it is essential that full details be provided. The rule is that there should be sufficient information to enable another researcher to duplicate the equipment. In extreme cases, this may involve describing the equipment in an appendix, or even in a supplementary report. The explanation should include details of how the equipment was constructed and calibrated.
The same principles apply to reporting details of the procedures used, as for equipment. It is important not only that others are able to duplicate the procedures but also that be possible for critics to judge their validity, and future readers to correct the results in the light of later discoveries. This means that sources of materials, and standards used for various measurements are particularly important. This section should also include descriptions of steps taken to establish controls and reduce errors. If, in carrying out the investigation, the researcher became aware of flaws that might have affected the results, these should be reported even though the results may have been discarded. Reporting unsuccessful approaches assists the reader in appraising the validity of the procedures employed, and also allows future research workers to avoid the same mistakes.
Findings
The chapter on the results of the research will also usually contain three sections:
· a summary of the data which yielded significant findings,
· a description of the method of analysis,
· presentation and interpretation of the findings.
There is no single method of presenting the findings, and each case must be treated on its merits. For a simple experiment, it may be sufficient to organize the material into the three sections already described. For larger studies dealing with different facets of a problem, it may be appropriate to organize the findings around the hypotheses and present all three sections for each hypothesis in turn. Similarly, for a study that involved a number of sequential tasks, it is often better to present each task completely before moving to the next. This is especially true where the results of one task influence the design of the experiment for the subsequent task. The key is to organize the data so that they can be understood, and the results and interpretation follow logically from the presentation.
Raw data are usually presented in an appendix, complete with the units of measurement. If it is impractical to present the raw data, which is usually the case in survey studies, the treatment to which the data have been subjected should be stated clearly. A summary of the data, often in tabular form, is presented in the body of the report. The use of tables and figures for the presentation of data is described in Appendix C. Issues involved in the use of graphs are described elsewhere in this chapter. The same principles should be applied to describing the methods of analyzing the data as for the presentation of the data itself. Sufficient information should be given in the report to allow the reader to understand the methods of analysis and assess their validity. The derivation of mathematical relationships or details of computer programs are usually presented in an appendix.
The final section in the chapter consists of a concise presentation of the results, often in tabular or graphical form. The use of tables and figures reduces the amount of text and allows for the emphasis of those findings that are most important. Be careful to use appropriate language in describing each result and the hypothesis being tested. A finding of statistical significance does not prove or disprove a particular hypothesis. Since the test of significance is based on the null hypothesis (explained in Chapters Two and Four) the results support or do not support a particular hypothesis. It is not unusual to find important results that are unrelated to the original hypothesis.
Discussion
The most important task in the discussion is to identify and interpret the major findings from the research, and the factors that may have influenced the outcome. The researcher should examine possible reasons why the results occurred and the validity of the hypotheses that were postulated. The results should also be compared with the findings of other research and an attempt made to explain the reasons for any differences. If the findings are not new, even though the supporting evidence is new, this should be stated and the original work referenced. In this way, the results should be fitted into the broader state of existing knowledge. It is also appropriate to discuss application of the findings and the direction that further research might take.
Having completed the study, the researcher has developed a much greater understanding of the problem than will usually be the case for most persons reading the study, and interpretations usually have greater insight than the readers would make for themselves. A great deal of thought and careful study is required in interpreting and applying research results. This is the area in which the difference between the experienced researcher and the student is most apparent. Knowledge and experience are needed, both to place the result in a broader context, and to assess potential applications.
Conclusions
The conclusions chapter is usually short, consisting of the findings of the study, and suggestions for further work, which might be additional research or application of the findings.
The conclusions chapter is the one most often read by others, who may choose not to read the body of the report. Consequently every effort should be made to make the conclusions clear and concise. Conclusions are often listed by number in a logical order, such as importance, general to specific, or from laboratory to field work, and expressed in one or two sentences. This is not the place for lengthy explanations or qualifications (which belong in the discussion chapter) and definitely not the place to introduce new material. The conclusions should develop logically from the findings and be free from speculation and assumptions.
It should not be necessary to point out that all the conclusions must be derived directly from the findings and relate to the problem under investigation. Nevertheless, there are a surprising number of reports published that contain conclusions outside the scope of the study!
Implementation
The report may include a chapter on implementation activities, or it may be more appropriate that an implementation plan be prepared by the client. The decision is largely a function of the researchers' knowledge of the organizational structure and resources of the client group, and the client's policy on the involvement of the researchers in implementation activities. These issues are discussed in Appendix C.
A chapter on implementation should contain a description of the activities that will be required to disseminate the results of the research effectively, and incorporate the findings into practice. It is important that the implementation plan be realistic with respect to the activities and resources needed, and the time required for completion. The level of detail provided will be determined by the amount of work involved in such activities as additional development, pilot projects, and preparing documentation.
References and Appendices
As noted in Chapter One in the section on ‘Professional and Ethical Research Practices’, the use of references is important in allocating proper credit to the work of other researchers. It also makes it clear whether the views expressed are original, and directs the reader to other sources of information. To maintain objectivity, articles which conflict with the findings, and those that support the views expressed should be cited.
There is an important distinction between references and a bibliography. References are those articles cited specifically in the text as the source of certain information. A bibliography is a compilation of articles on related studies. Articles in the bibliography may have been used as background information, or may be suggested for further reading, but they are not cited in the text. Publication policies usually require a standard format for citing and recording references. This is discussed in detail in Appendix C.
Appendices are used for information which is not essential to understanding the report, but which may be of interest or importance to some readers, especially those wishing to verify the study being reported. The following are typical examples of material that may be placed in appendices:
· glossary of terms
· notation
· details of equipment
· details of procedures
· experimental data
· mathematical derivations or calculations
· examples of data analysis
· source code for custom software
· copies of forms or questionnaires
· list of persons contacted during the study
· bibliography
· copies of related practices in other jurisdictions
· copies or quotations from articles which are difficult to obtain or no longer in print
· design aids, draft specifications, or suggestions for changes in other documents.
Technical Papers
Papers follow essentially the same organization as reports, and most of the principles that apply to writing reports also apply to writing papers. Space limitations in papers require that emphasis be placed on the method, results, and conclusions of the study. The format is dictated by the publisher, and the requirements may be very rigid, especially for camera-ready copy. The major differences between a report and a paper are:
· the preliminary material consists only of a title and abstract,
· the chapter titles become main headings,
· the introduction and literature review are short, and often combined,
· there are usually no appendices, although it may be necessary to include a section on definitions and notation,
· acknowledgments appear at the end.
Journals often limit the length of abstracts. Limits within the range of 150 to 300 words are common. TRB limits abstracts to 250 words. The introduction and literature review must be concise. The goal should be to orient the reader and connect the new work with the current situation in the field, while explaining succinctly the objectives of the current investigations. It is not necessary, or even desirable, to provide a detailed summary of the literature. However, the major findings of the most relevant previous work should be summarized so that the reader can see where the new work fits in with the old and, if so inclined, obtain copies of the earlier work. Sufficient references should always be given to enable the history of past work to be traced. The main sections of the paper deal with methodology, results, and conclusions. Discussion should be included, but is much shorter than would appear in a report. The content of a paper is determined by the need to provide sufficient detail that the reader can judge the validity of the experimental design, findings, and interpretation of the findings. In this respect, it is useful if reference can be made to a final report on the study, so that the reader can obtain more information on any aspects of interest.
Graphs are powerful techniques for identifying or illustrating relationships not apparent from equations and tables. Trends and patterns are much more easily discerned when presented in graphical form, but, by the same token, graphs can be misused, so that trends seem to emerge where none actually exist.
Most graphs have a linear scale on both axes, and include the origin. However, there are a number of processes, which are essentially nonlinear, such that plotting the data on linear graph paper distorts the relationships. In other cases the range of values is so great that the data cannot be plotted on a linear scale without losing most of the lower values. In this case the data could be converted to logarithmic form, and plotted on a linear graph, or plotted directly on logarithmic graph paper. A logarithmic axis consists of a number of cycles of equal length, the first representing 1 to 10, the next 10 to 100, the third 100 to 1000 and so on.
Semi-logarithmic graph paper is linear on one axis and logarithmic on the other. Logarithmic graph paper (usually called log paper) is logarithmic on both axes. In general, semi-log paper is used for representing relationships of the form:

while log paper is used when the expression can be expressed in the form:
Where the nature of a relationship is not known, the data can be plotted on the three types of graph paper to determine which form of presentation gives the straightest line. Abuses of use of graphs are not uncommon. While the deliberate misuse of graphical presentation is more common in advertising material, inappropriate choice of presentation can result in errors and false impressions, even if done inadvertently.
One of the most common errors is to construct a relationship from two points on a graph as shown in Figure 22. There is no more justification for joining the two points by a straight line, than there is for constructing the curve shown, (or any other curve which passes through points A and B). The situation is made much worse if the purported relationship is extrapolated to predict future behavior. Extrapolation can be used to justify any future value.
Graphs can also be distorted by expanding a portion of the scale and suppressing the origin. The graphs shown in Figure 23 display exactly the same data. While Figure 23(a) displays modest growth, Figure 23(b) gives the impression of rapid growth. Needless to say, this technique is not unknown in the investment community! This is not to imply that the origin should be included in every graph, or that excluding the origin always distorts the information. There are occasions when the area of interest is away from the origin and trends can only be shown by expanding the region of the graph that contains the data points. There are other techniques for misrepresenting data in graphs. One method is to break either the vertical or horizontal scale such that a modest increase or decrease can be made to look like a quantum leap. Another technique is to use different scales on graphs that are intended to be compared.
Cumulative data plots can also be used to disguise real trends. Table 2 shows the quantities of rock excavated by a contractor on a construction project over a period of 20 weeks. Week 1 represents the start of rock excavation under a proficient rock foreman who was assigned to another project after seven weeks. High production levels continued for a few weeks because of the momentum from the first foreman’s efforts, but his replacement was less proficient, and there was a decline in production, as shown in Figure 24(a). However, by plotting cumulative output, beginning in week 8, as shown in Figure 24(b), the reduction in output is not readily apparent. Only a skilled observer would notice the gradual, but continuous, change in the slope of the graph.
Pictographs, which are pictorial displays of statistical information, can also be used to give a false representation of data. If, as in Figure 25(a), a picture of a winding gear is used to represent the production of a gold mine A, then an accurate representation of the production of gold mine B, which is double that of gold mine A, would be two pictures of the same winding gear. However, if gold mine B is represented by a single winding gear, which is twice as tall as gold mine A, as shown in Figure 25(b), a very different impression is conveyed. Because the width of the winding gear has also been doubled, the visual impression is that the production of gold mine B is four times that of gold mine A.
The final caveat is that graphs should not be used to illustrate selected data points, but should show all the data. The consequences of this approach can be illustrated by the investigation that followed the explosion of the space shuttle Challenger on January 28, 1986. The investigation revealed that the cause of the accident was the failure of O-ring seals on one of the solid-fuel booster rockets. It is now known that the seals had a high probability of failure at cold temperatures, and that the temperature at launch time was 36°F.
According to the Presidential Commission on the Space Shuttle Challenger Accident, the propensity of the O-rings to failure at low temperatures could have been predicted but the available data were not analyzed correctly. Thermal distress had been observed in some O-rings and was plotted as a function of temperatures as shown in Figure 26(a). This shows that there was nothing to suggest that the number of incidents was a function of temperature. However, when the data from all the flights were plotted, including those where no incidents occurred, Figure 26(b) was generated.
The data in Figure 26(b) show that only three incidents of distress occurred out of 20 flights with O-ring temperatures of 66°F or greater, whereas all four flights with O-ring temperatures at 63°F or less experienced thermal distress. In other words, if all the data had been evaluated, the susceptibility of the O-rings to failure at temperatures of 63°F or less might have been apparent.

Figure 22: Fallacy of Constructing a Relationship from Two Data Points
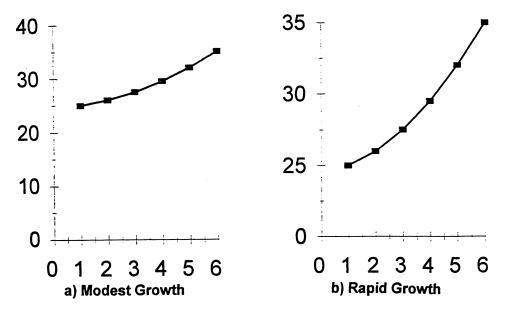
Figure 23: Effect of Expanding the Scale and Suppressing the Origin of a Graph
Table 2: Rock Production Over a Period of Twenty Weeks
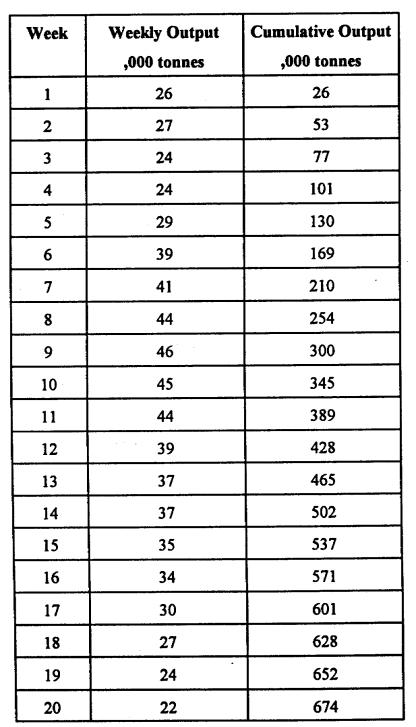
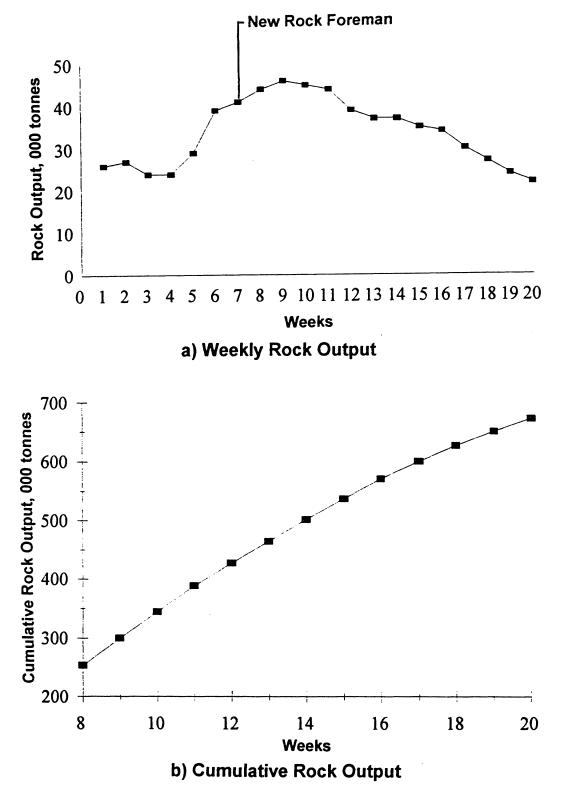
Figure 24: Effect of Plotting Cumulative Distributions
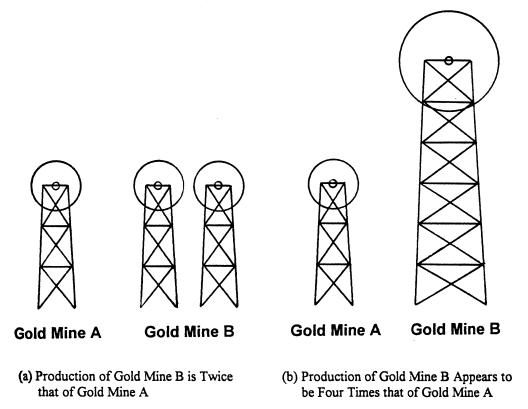
Figure 25: Example of the Use of Pictographs to Misrepresent Statistical Data
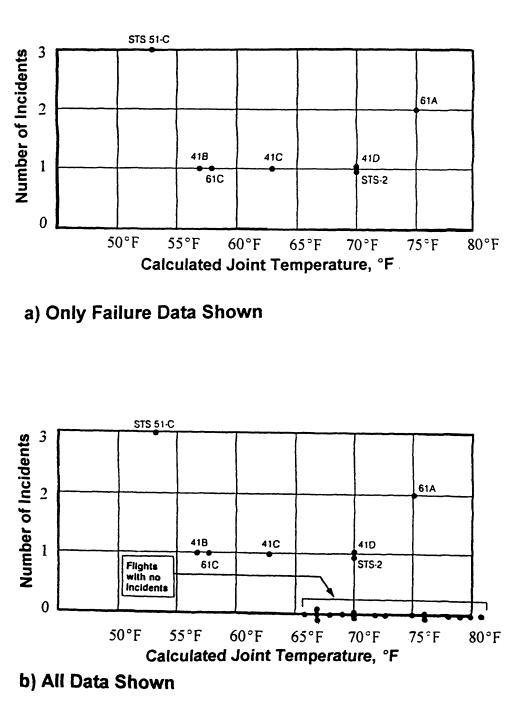
Figure 26: Effect of Plotting Selected Data Points
Copyright laws are designed to protect intellectual property, including printed matter, music (in its many forms), video images, and computer programs. In most countries, the laws were drafted before the technology for mass and instantaneous reproduction of words, sounds, images, data and programs existed. Photocopiers, video-recorders and personal computers are relatively recent inventions and the laws have not kept pace with technology. The growth of the Internet, which enables individuals to download, reproduce and transmit digital files around the world in seconds, has created new issues for those trying to protect intellectual property, and for those wishing to use copyrighted material for legitimate purposes.
In the United States, the relevant law for most publishing purposes is the Copyright Act of 1976, which took effect on January 1, 1978. The 1976 act was a major revision of prior law, superseding previous federal law, and eliminating (though not retroactively) many state laws. Pre-1978 works continue to be governed by prior law. Copyright law is complex. A very useful introduction to the subject is contained in the Chicago Manual of Style (14).
For the individual researcher, the doctrine of “fair use” is important because it guides, but does not define, what can be quoted from copyrighted work without permission. In determining whether or not the use made of a work in any particular case is fair, the factors considered must include the following:
· The purpose and character of the use, including whether such use is of a commercial nature or is for nonprofit educational purposes.
· The nature of the copyrighted work.
· The amount and substantiality of the portion used in relation to the copyrighted work as a whole.
· The effect of the use upon the potential market for, or value of, the copyrighted work.
The fair use doctrine allows authors to quote from other author’s work or to reproduce small amounts of graphic or pictorial material for purposes of review or criticism, or to illustrate or buttress their own points. Authors invoking fair use should transcribe accurately, not quote out of context, and give credit to their sources.
The Transportation Research Board provides more specific guidance and includes the following instructions to authors preparing synthesis reports for publication in the NCHRP Synthesis of Highway Practice and Synthesis of Transit Practice series.
“Permission is not needed for brief quotations (50 words or fewer) when the source of the quote is properly referenced. Permission must be obtained to use longer quotations.
Material published by the U.S. government is not usually copyrighted and, if not, does not require permission, unless it credits a previously copyrighted source. Permission to use copyright should also be acknowledged. A typical acknowledgment should read ‘Reprinted with permission from Reference 32 Copyright 1985 American Institute of Physics’.”
As noted in the preceding quote, works published by the United States government are in the public domain. When a work consists “preponderantly” of materials created by the United States government, those parts for which copyright is claimed must be identified in the publication. Works produced by state or local governments, are not in the public domain.
It is the responsibility of authors who wish to reproduce copyrighted material, which may include figures, photographs, tables and charts, to obtain permission before publication. Securing permission can be a lengthy process. Publishers receive numerous requests, and every case must be checked to ensure that the publisher does indeed hold the copyright to all the material covered by the request. In asserting the importance of the fair use doctrine to scholarship, the Chicago Manual of Style (14) makes the following statement:
“A word of practical caution: if a use appears to be fair, the author should probably not ask permission. The right of fair use is a valuable one to scholarship, and it should not be allowed to decay through the failure of scholars to employ it boldly. Furthermore, excessive caution can be dangerous if the copyright owner proves uncooperative. Far from establishing good faith and protecting the author from suit or unreasonable demands, a permission request may have just the opposite effect. The act of seeking permission indicates that the author feels permission is needed, and tacit admission may be damaging to the author’s defense.”
The Copyright Act also contains guidelines for photocopying by libraries. In general, it allows libraries to make single copies of copyrighted works, providing each copy bears the original copyright notice, and providing the copies are made for one of the purposes specifically defined in the statute. This includes making a copy for a patron’s use, and is limited to an article or small part of a larger work (or the whole of a larger work if a printed copy cannot be obtained at a fair price), and only if the copy is intended for use by the patron in “private study, scholarship, or research.” The law specifically prohibits “systematic” copying by libraries, which is taken to mean making copies of books or periodicals as a substitute for buying them, or making copies for patrons without regard to the patron’s intended use of the material.
This section provides a brief summary of the requirements for making visual aids and giving a successful oral presentation. Much more detailed guidance is contained in the book ‘Presenting Yourself’, prepared for the Eastman Kodak Company (15).
Visual Aids
It should not be forgotten that presentations could be given successfully without the use of visual aids. This statement puts the use of visual aids in perspective. It means that visual aids should only be used if they will result in a clearer presentation. Visual aids can be very useful in demonstrating relationships, emphasizing ideas, and clarifying difficult points more quickly and clearly than doing without them. The most common forms of visual aids used in formal presentations are 35 mm slides, overhead transparencies, and, more recently, computer-generated images.
The first rule of visual aids is that they must be legible. There are several rules for checking the legibility of 35 mm slides:
· Hold the slide to the light at arm’s length. All the text should be legible.
· Project the slide so that its image (horizontal or vertical, whichever is longer) on the screen measures 1.27 m (50 in.). The height of the letters (including lowercase) and the numbers should measure at least 25 mm (1 in.) on the screen. This is the same as saying that all the characters should be at least 2% of the longer dimension of the slide.
· The minimum size for text in all capitals is 24 point, and for capitals and lowercase it is 32 pt. The latter is easier to read.
· A sans serif typeface such as Helvetica, Arial, or Universal is easier to read than a serif typeface such as Times.
For transparencies to be used on an overhead projector, the minimum size of letters should be 5 mm (3/16 in.). An overhead projector is well suited to small meetings, and adds to the informality because the room need not be dark, but is rarely suitable for audiences more than about 40.
Visual aids used in a presentation must be twice as simple and four times as bold as those used in a written report, according to Transportation Research Board guidelines. Figures and tables in reports are not suitable for use as visual aids. They must be simplified and redrawn. Numbers should be rounded off and abbreviations used wherever possible. Unnecessary lines and grid rulings should be eliminated. An example of a table as it would appear in a report, and how it might be simplified for presentation, is shown in Figure 27. TRB recommends the following rules for keeping slides simple:
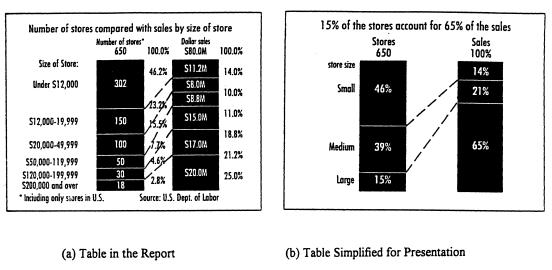
Figure 27: Simplification of a Table for Presentation
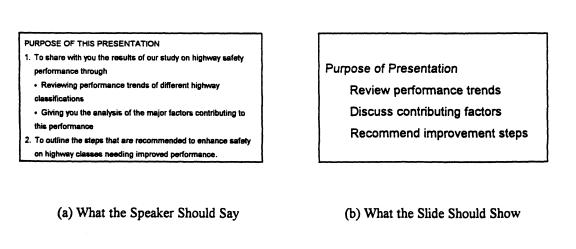
Figure 28: Example of a Text Slide
· Use a one-line title
· Use a maximum of 6 or 7 lines
· Use a maximum of 6 to 8 words per line
· use only one sub-level.
Slides that contain only text should not be used to replace cue cards. Text should be very terse and used only to explain complex concepts or emphasize groups of ideas. An example of what a speaker might say, and what should appear on the corresponding text slide, is shown in Figure 28.
Color should be used with a purpose, not simply for decoration. Appropriate uses of different colors are for a title, to emphasize a trend line, identify a recurring theme, or highlight significant data points. Contrasting colors such as white or yellow lettering against a black, deep blue or green background are most effective.
Computer software is available for the preparation of both 35 mm and overhead slides, or to generate images to be projected directly from the computer. There are a number of advantages in using such software:
· Templates are available to assist with color schemes and layout
· The software offers a wide selection of graphics to add interest
· Images can be imported from other applications
· Features such as highlights, shading and 3-D images are available
· Slides can be edited relatively easily.
If the images are projected directly from the computer, there is a wide range of features that can be used to generate a dynamic and interactive presentation. The possibilities are almost unlimited. For example, during a presentation it is possible to visit Internet sites, play a sound file, show a movie clip, or open another application such as a spreadsheet program. The spreadsheet could then be used to illustrate, almost instantaneously, the consequences of changes in one or more variables. There are also transition features that move to the next image by techniques such as fading in, rolling in from the side, or opening from the center of the screen.
There are so many features available that there is a temptation to use the more spectacular features for their own sake. The basic rules of content and legibility given for slides also apply to computer-generated images. It must be remembered that the purpose of visual aids is to assist in delivering a message, and not to distract the audience.
Making the Presentation
The most important part of delivering a presentation is preparation. Even the most experienced speakers rehearse their presentations. Rehearse a first time alone, preferably with a tape recorder, and a second time in front of colleagues who will provide constructive criticism. Prepare cue cards that are easy to read, even in poor light, and make sure the presentation can be given in the time allotted. Most presentations take longer in the session than in rehearsal and it is useful to record time checks on the cue cards, i.e. where you should be after 5, 10 and 15 minutes in order to finish on time. A hurried or abrupt conclusion can ruin an otherwise good presentation.
The room and equipment should be checked out before the session begins. Make sure you know how to use the microphone, lectern lamp, slide changes and pointer. Be sure to have a watch, preferably a stopwatch. Also be sure that the chairman has all the information he needs about you.
When using a computer projection system, it is essential that the operation of all the equipment be checked thoroughly, under the same conditions that it will be used in the presentation, before the session begins. While such equipment offers enormous opportunities to add interest to a presentation, an unfortunate corollary is that the more sophisticated the techniques, the greater the likelihood of a malfunction.
The single biggest mistake in delivering a presentation is to read the paper. Talk naturally to the audience, use eye contact and move your eyes around the room. Let your confidence, conviction and enthusiasm come to the fore. Don’t be afraid to make mistakes such as getting points out of order, or missing a point altogether. Only you know exactly how you intended to present the information.
When it comes time for questions, allow the chairman to control the session. Be patient with the questioner, listen to the question, and pause before responding. Repeat the question if it was not heard clearly by members of the audience. Answer only the question asked, no more and no less in order to be fair to others wishing to ask a question. Make the questioner feel the question was important.
Following these simple rules will contribute immeasurably to success of the presentation and one’s standing as a professional.